
pfizer_adverse_event_tables.xlsx: What Pfizer's Own Safety Data Reveals. The code for extracting the numbers from Pfizer's Papers is written to allow anyone to nicely visualize them
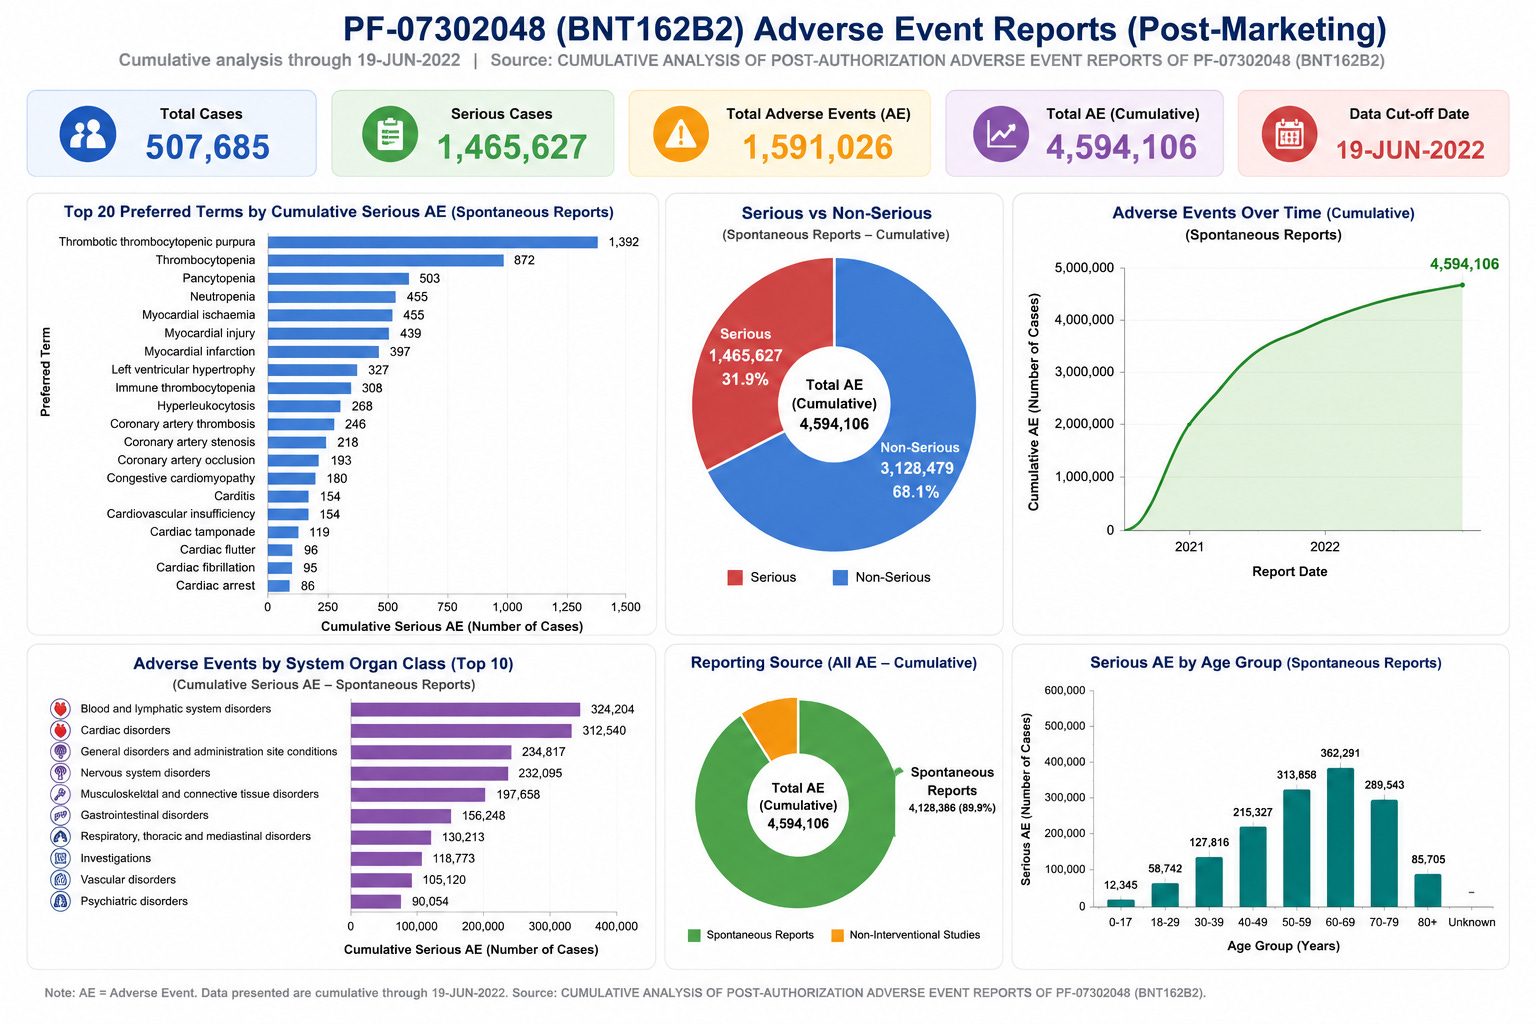
An independent visual analysis of Pfizer's cumulative post-marketing adverse event report tables (through 19 June 2022), based on the company's own published data.

Input - Source:

Output: XLSX
Important limitation
The source PDF is image-only and contains dense ruled tables. Extraction required OCR. The CSV should be treated as a working dataset, not a validated regulatory transcription. OCR can confuse letters (for example, “Abnormal” may become “Abnonnal”) and may omit or misread isolated numbers. Verify findings against the PDF page identified in the `page` column before publication or formal analysis.
Column meanings
page: page number within the uploaded 150-page PDF.
system_organ_class: MedDRA System Organ Class detected from the page heading.
preferred_term: MedDRA Preferred Term.
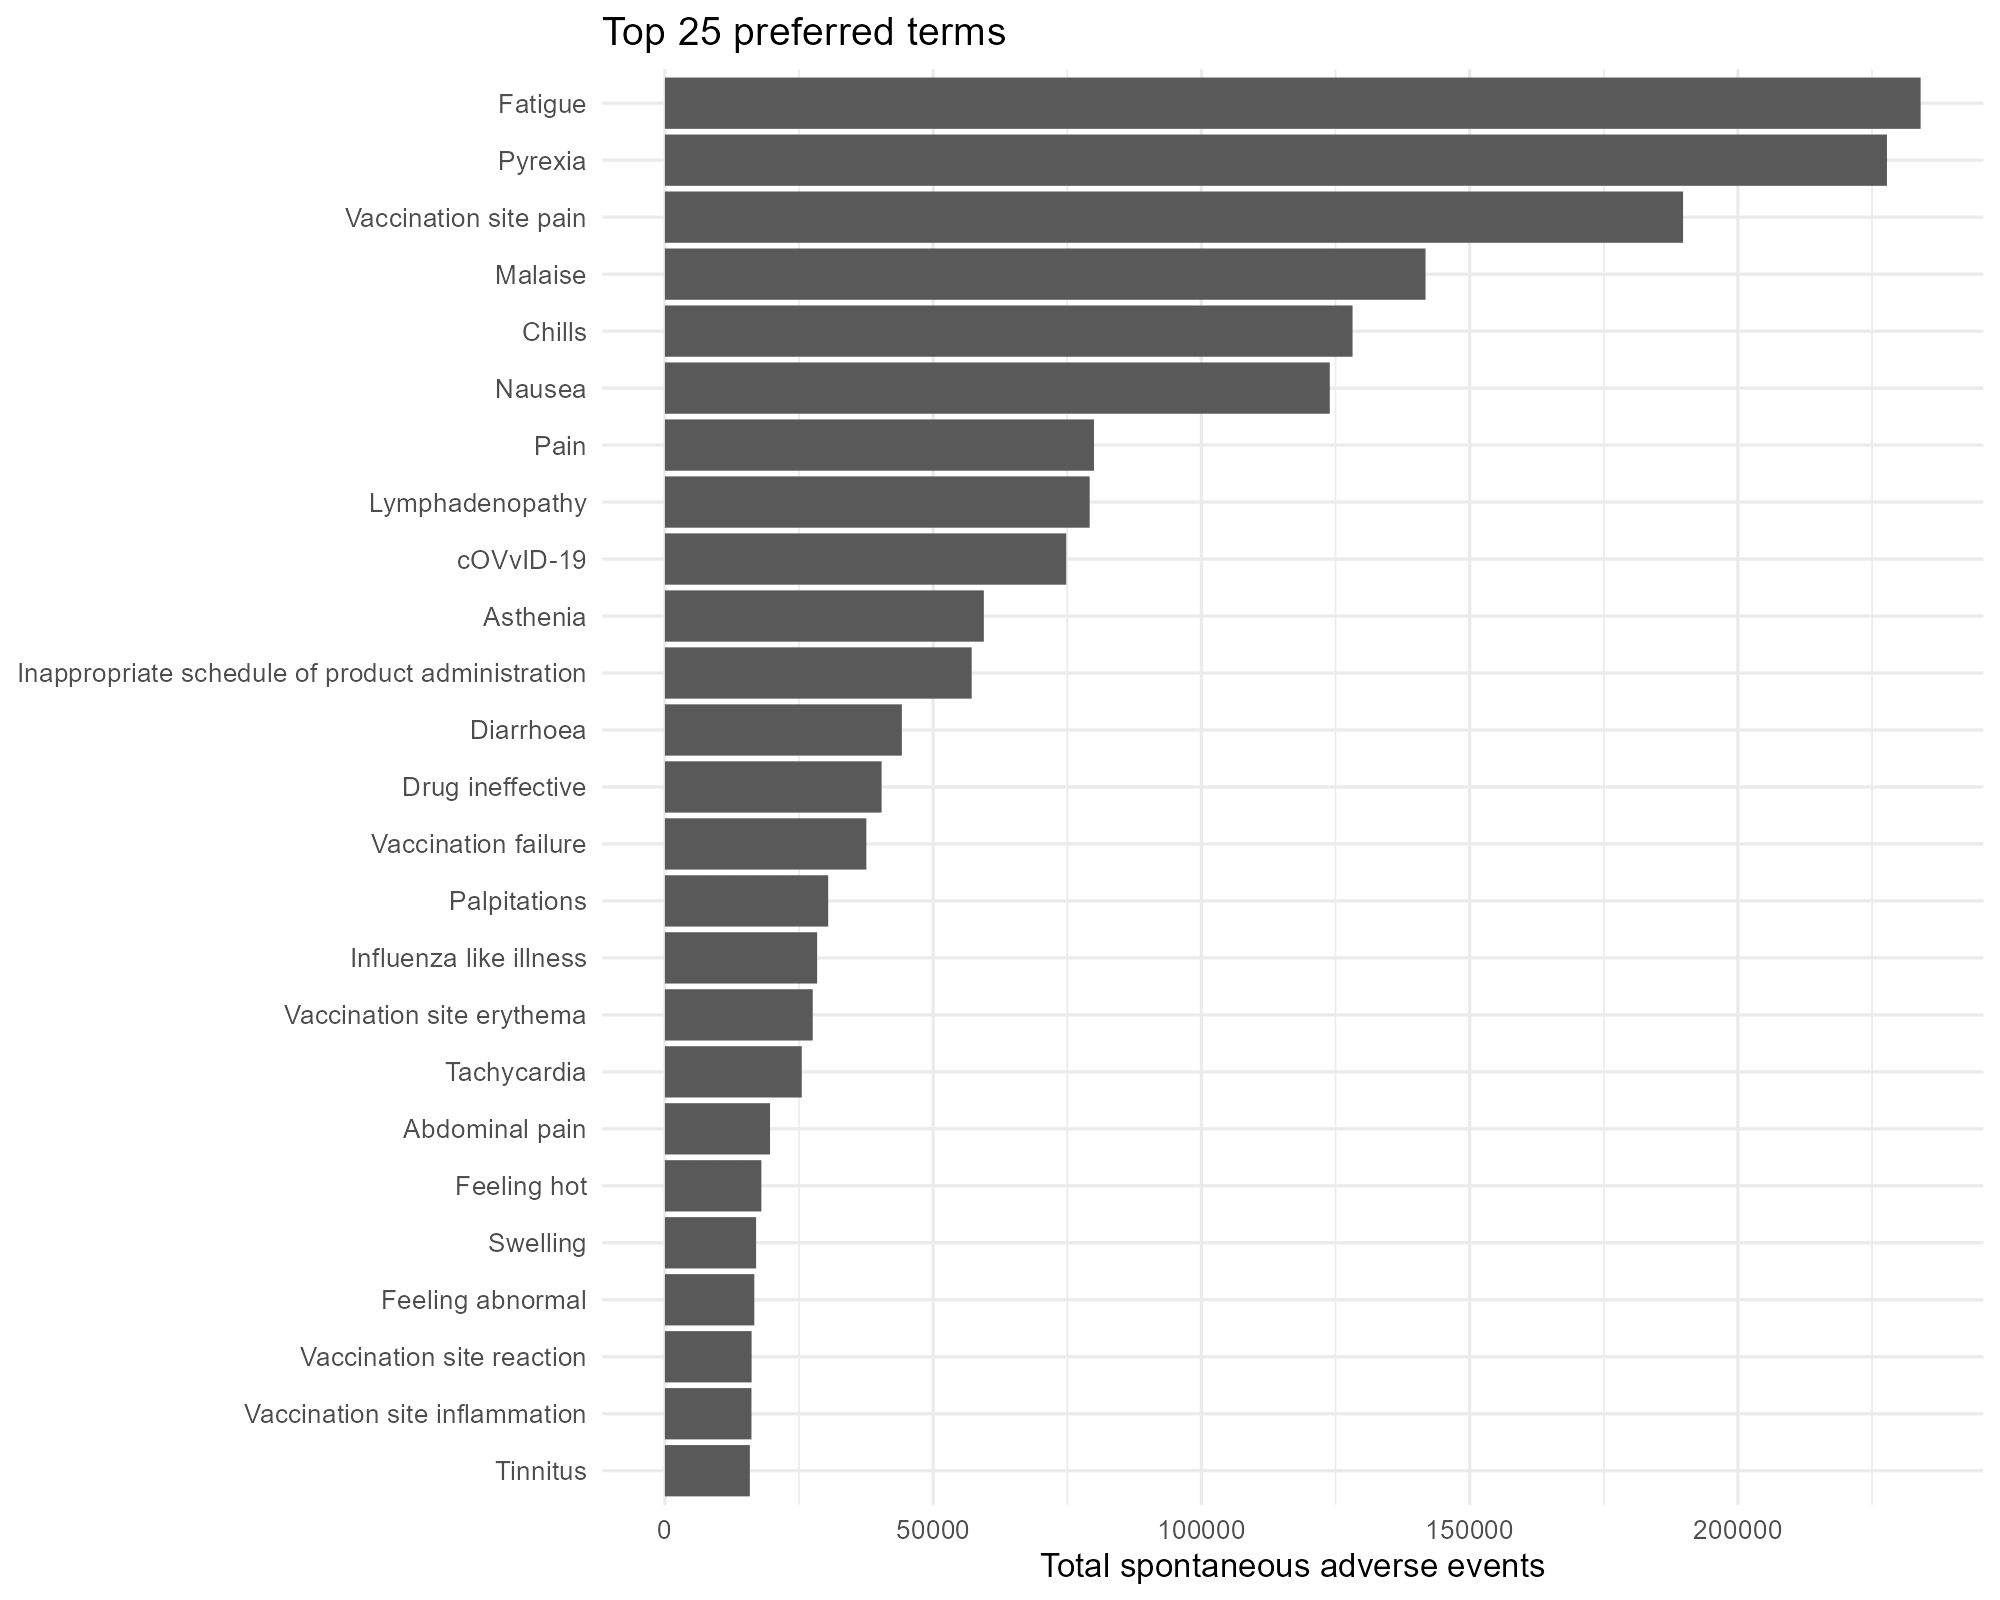
total_spontaneous_ae: total number of spontaneous adverse events for the term.
spont_serious_interval/cumulative: serious spontaneous reports, interval/cumulative.
spont_nonserious_interval/cumulative: non-serious spontaneous reports, interval/cumulative.
nis_serious_interval/cumulative: serious non-interventional study reports, interval/cumulative.
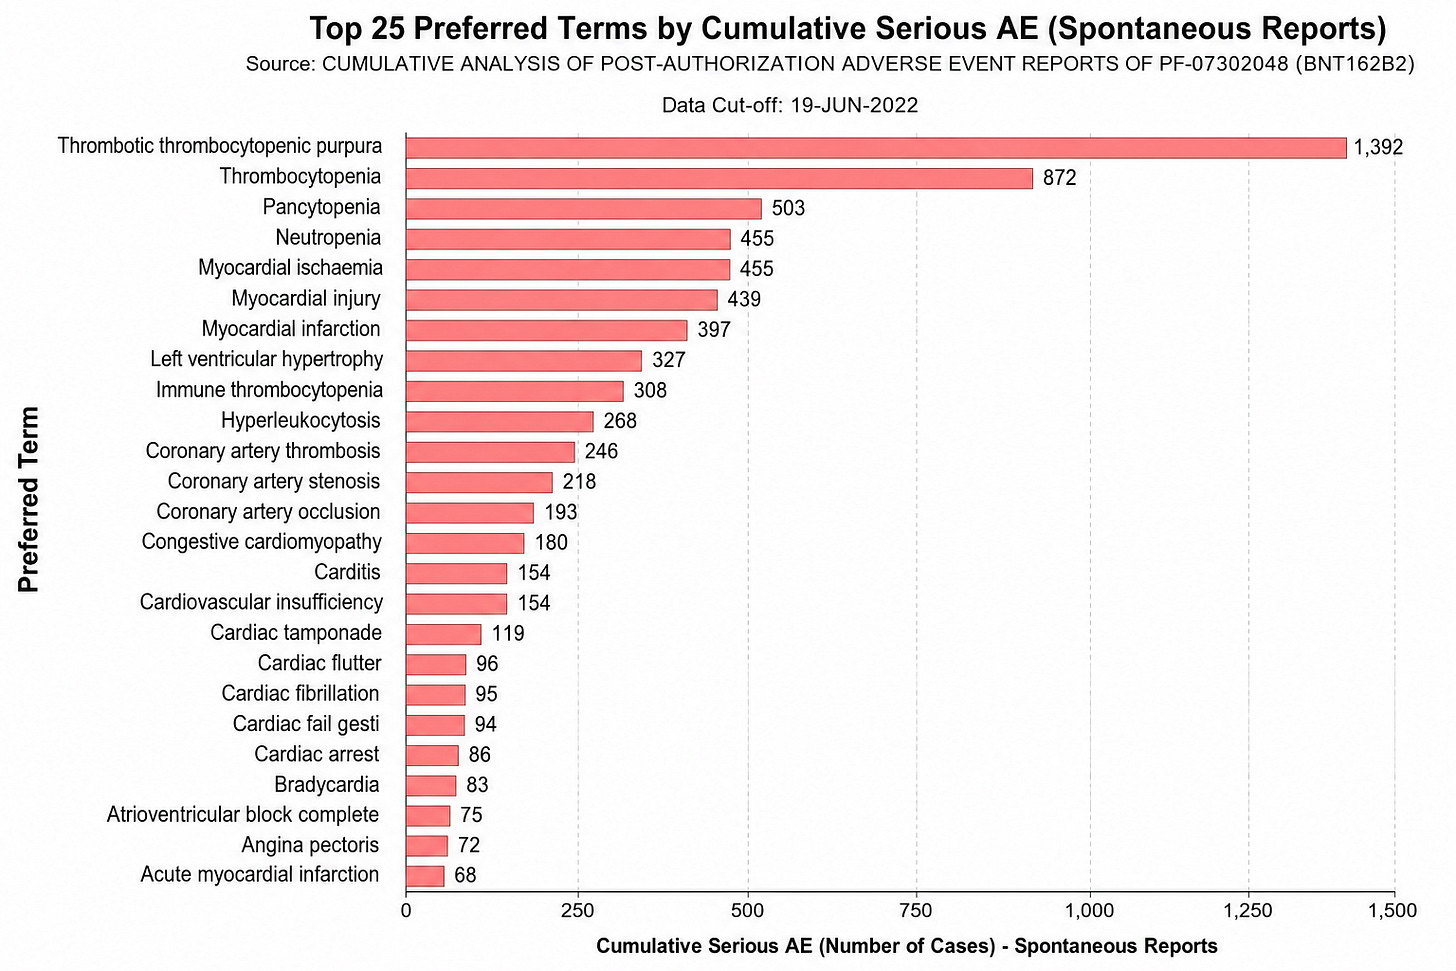
Appendix: R Code
# analyze_pfizer_adverse_events.R v0.1.1 ----
# Fixed invalid .SD2cols/.SD3cols use and avoided adding interval to cumulative counts.
# Reads the OCR-extracted Pfizer table CSV and creates exploratory summaries/plots.
library(data.table)
library(ggplot2)
read_pfizer_ae <- function(path) {
x <- fread(path, na.strings = c(”“, “NA”))
num <- setdiff(names(x), c(”system_organ_class”, “preferred_term”))
x[, (num) := lapply(.SD, as.numeric), .SDcols = num]
x[, `:=`(
spontaneous_interval = rowSums(.SD, na.rm = TRUE),
spontaneous_cumulative = rowSums(.SD, na.rm = TRUE)
),
.SDcols = c(”spont_serious_interval”, “spont_nonserious_interval”)]
x[, spontaneous_cumulative := rowSums(.SD, na.rm = TRUE),
.SDcols = c(”spont_serious_cumulative”, “spont_nonserious_cumulative”)]
x[, `:=`(
serious_share = fifelse(spontaneous_cumulative > 0,
spont_serious_cumulative / spontaneous_cumulative, NA_real_),
total_check = spontaneous_cumulative - total_spontaneous_ae
)]
x[]
}
plot_top_terms <- function(x, n = 25) {
z <- x[order(-total_spontaneous_ae)][1:min(n, .N)]
ggplot(z, aes(reorder(preferred_term, total_spontaneous_ae), total_spontaneous_ae)) +
geom_col() + coord_flip() +
labs(title = sprintf(”Top %d preferred terms”, n), x = NULL, y = “Total spontaneous adverse events”) +
theme_minimal(base_size = 12)
}
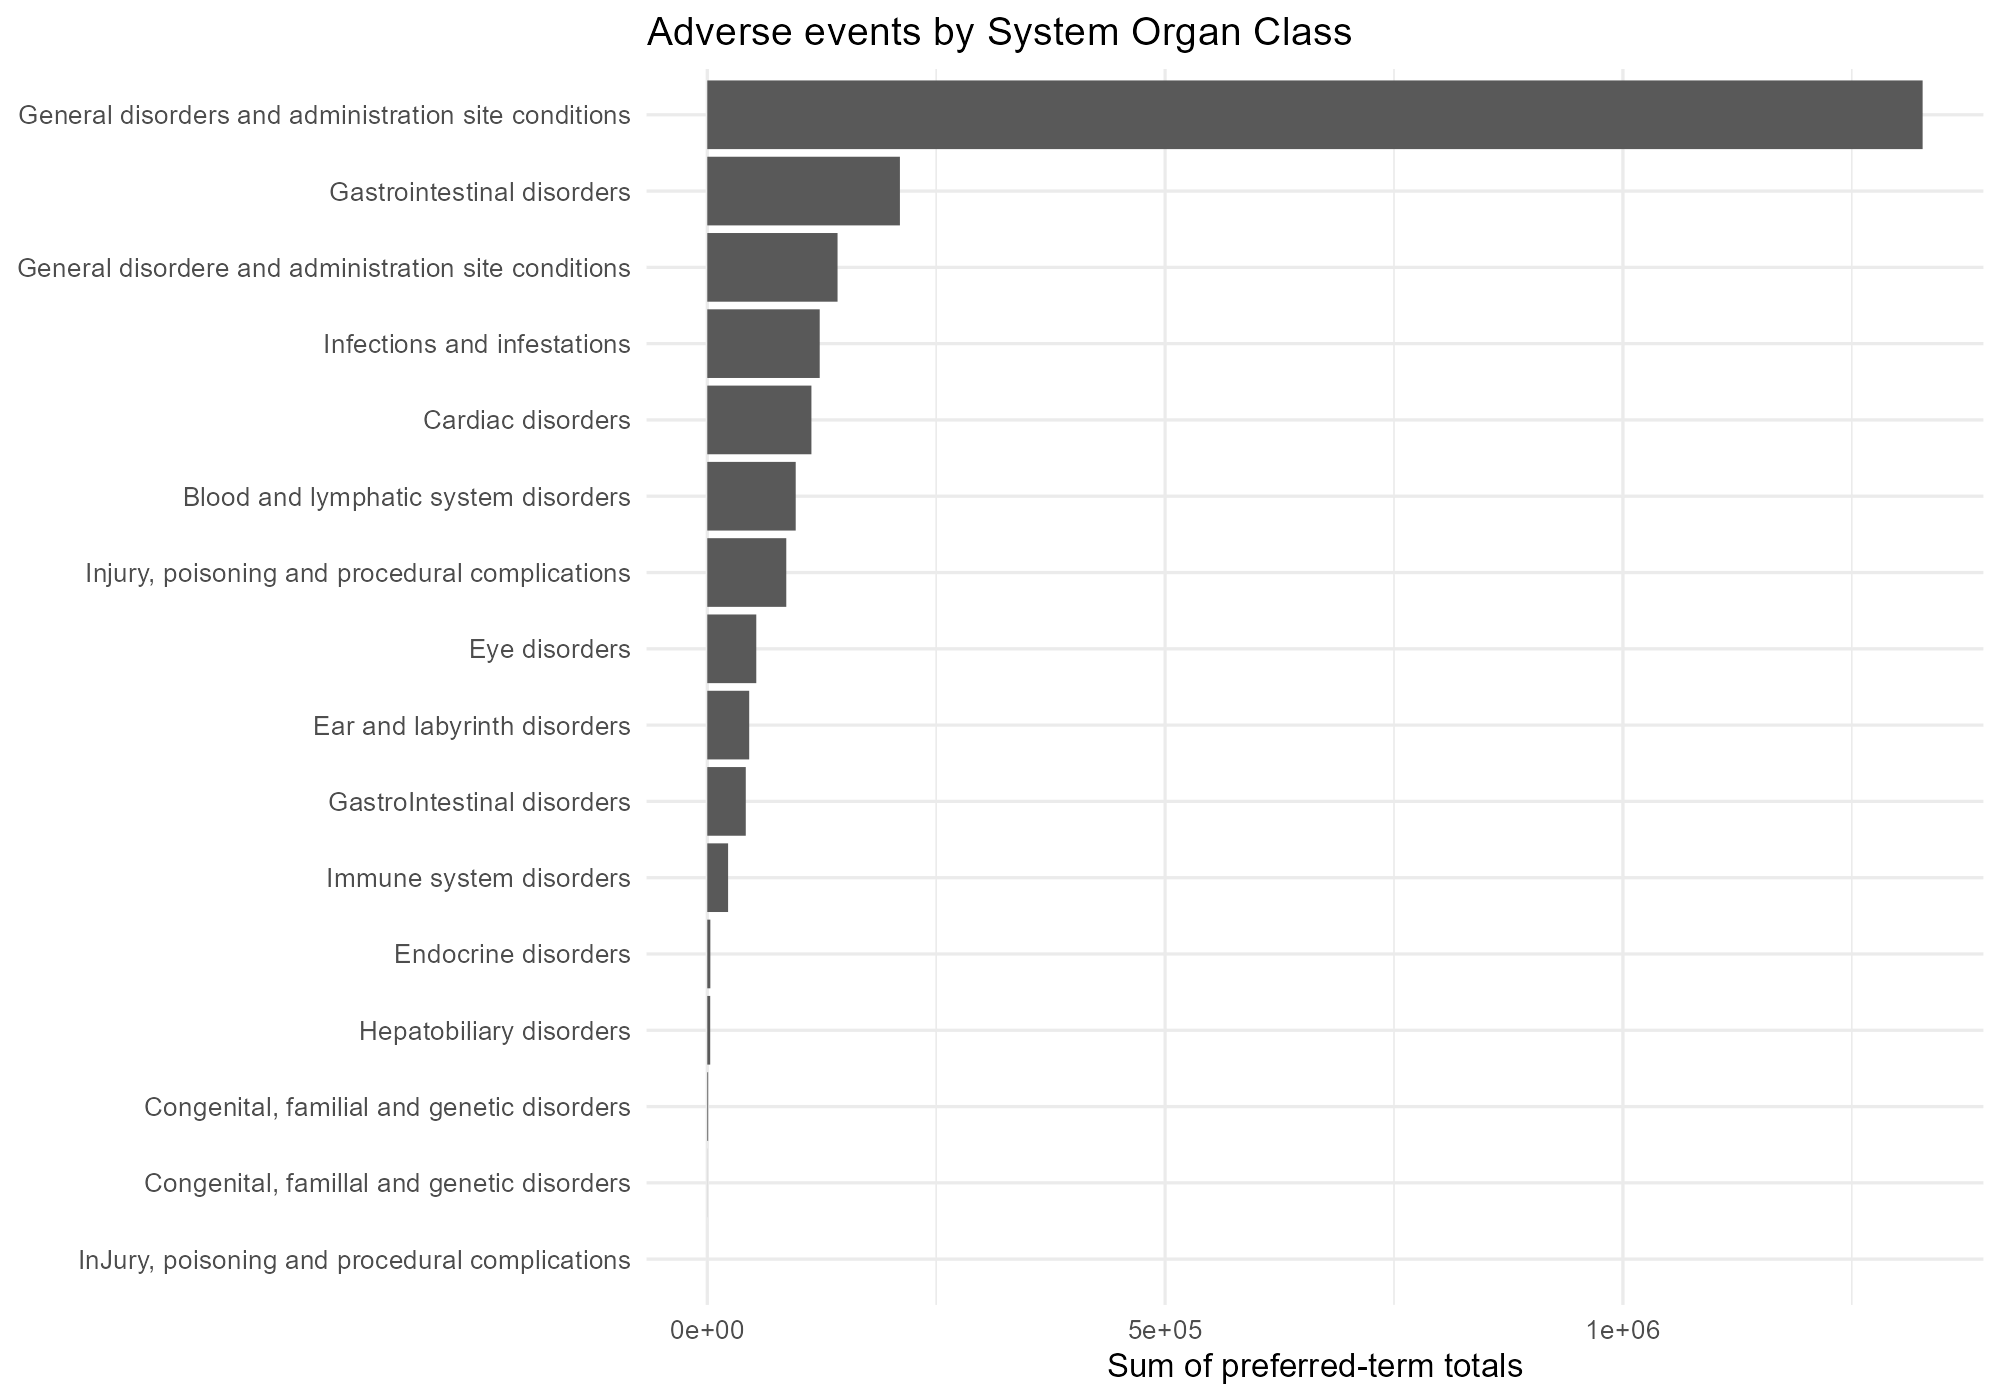
plot_soc_totals <- function(x) {
z <- x[, .(total_spontaneous_ae = sum(total_spontaneous_ae, na.rm = TRUE)), by = system_organ_class][order(total_spontaneous_ae)]
ggplot(z, aes(reorder(system_organ_class, total_spontaneous_ae), total_spontaneous_ae)) +
geom_col() + coord_flip() +
labs(title = “Adverse events by System Organ Class”, x = NULL, y = “Sum of preferred-term totals”) +
theme_minimal(base_size = 12)
}
plot_serious_share <- function(x, n = 25, min_total = 100) {
z <- x[total_spontaneous_ae >= min_total & !is.na(serious_share)][order(-serious_share)][1:min(n, .N)]
ggplot(z, aes(reorder(preferred_term, serious_share), serious_share)) +
geom_col() + coord_flip() + scale_y_continuous(labels = scales::percent) +
labs(title = sprintf(”Highest serious-event share (minimum total = %s)”, min_total), x = NULL, y = “Serious share”) +
theme_minimal(base_size = 12)
}
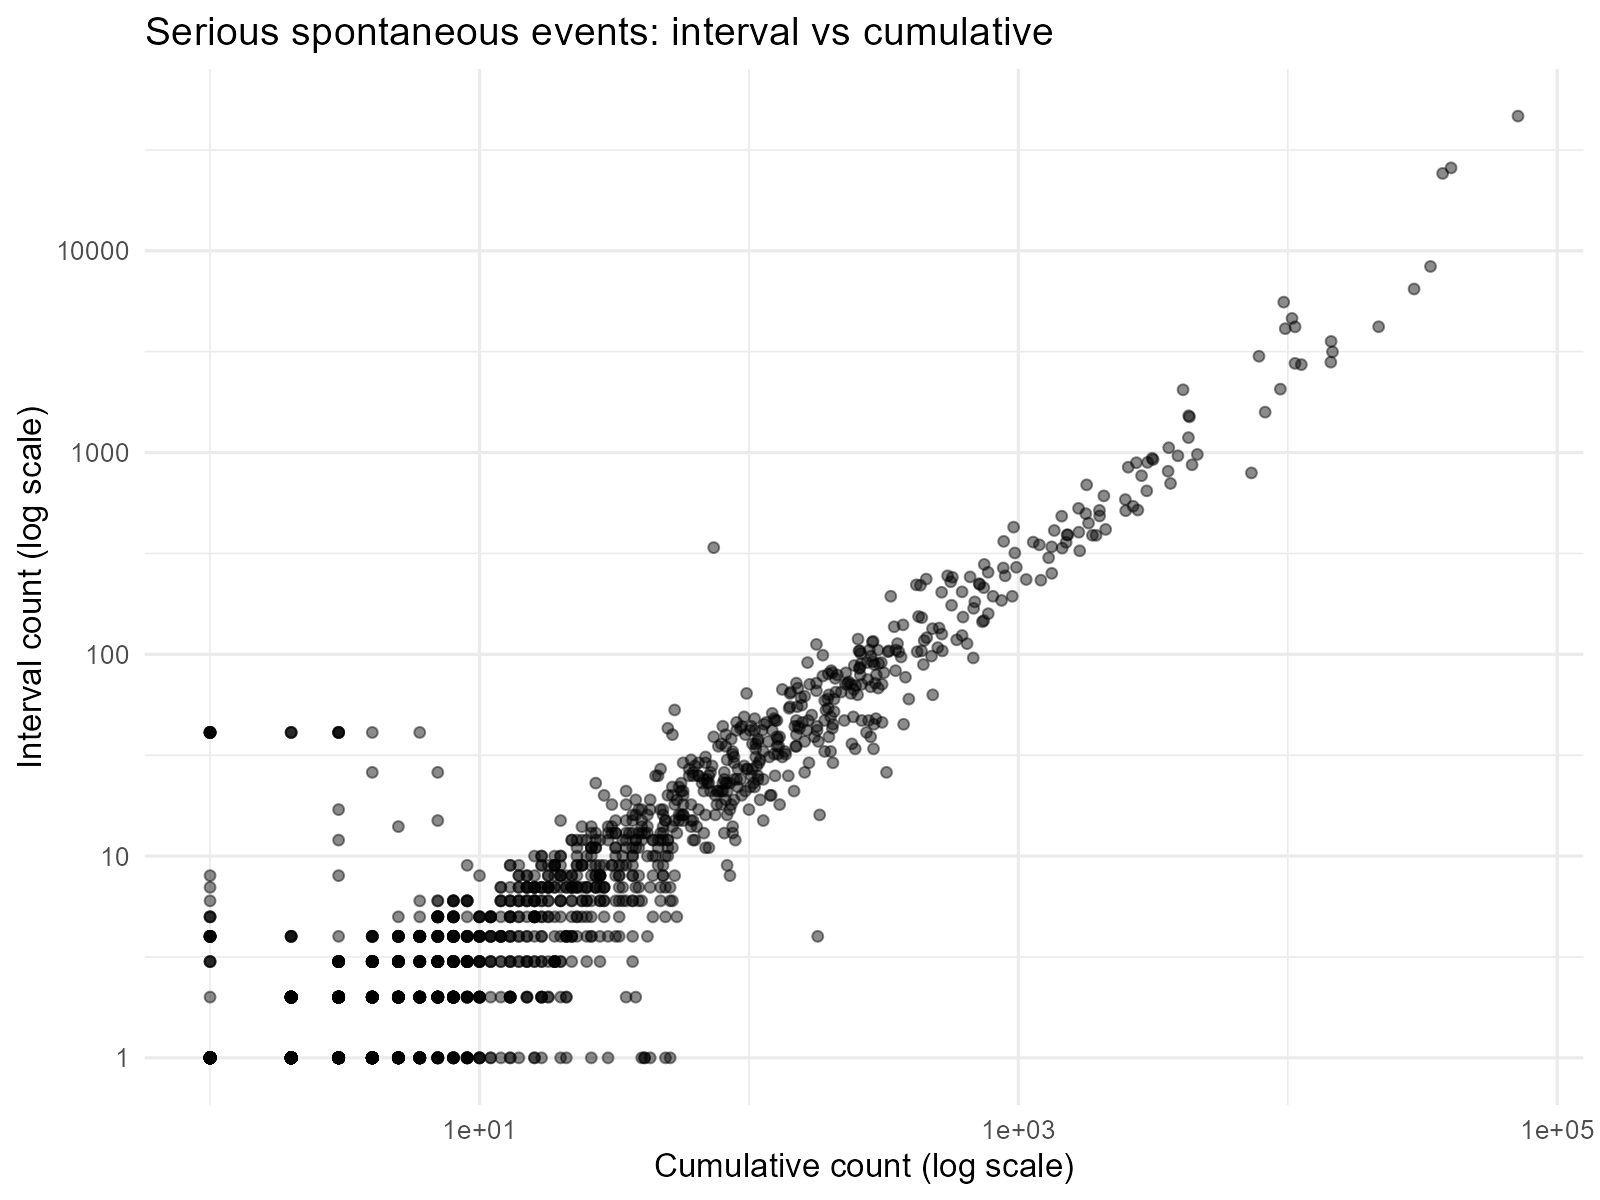
plot_interval_vs_cumulative <- function(x) {
z <- x[spont_serious_cumulative > 0 & spont_serious_interval > 0]
ggplot(z, aes(spont_serious_cumulative, spont_serious_interval)) +
geom_point(alpha = 0.45) + scale_x_log10() + scale_y_log10() +
labs(title = “Serious spontaneous events: interval vs cumulative”, x = “Cumulative count (log scale)”, y = “Interval count (log scale)”) +
theme_minimal(base_size = 12)
}
search_terms <- function(x, pattern)
x[grepl(pattern, preferred_term, ignore.case = TRUE) | grepl(pattern, system_organ_class, ignore.case = TRUE)][order(-total_spontaneous_ae)]
if (F) {
csv <- “pfizer_adverse_event_tables.csv”
ae <- read_pfizer_ae(csv)
print(ae)
print(search_terms(ae, “myocard|pericard”))
ggsave(”top_terms.png”, plot_top_terms(ae), width = 10, height = 8, dpi = 200)
ggsave(”soc_totals.png”, plot_soc_totals(ae), width = 10, height = 7, dpi = 200)
ggsave(”serious_share.png”, plot_serious_share(ae), width = 10, height = 8, dpi = 200)
ggsave(”interval_vs_cumulative.png”, plot_interval_vs_cumulative(ae), width = 8, height = 6, dpi = 200)
}